
Stay informed with free updates
Simply sign up to the Visual and data journalism myFT Digest — delivered directly to your inbox.
This article was first published in the FT Climate Graphic: Explained newsletter
This week Copernicus, Europe’s Earth observation agency, released its monthly bulletin for February and again it makes for sobering reading.
Despite February being the third hottest on record at 13.36C, slightly below last year’s record, it is still 1.59C above the pre-industrial average.
The 1.5C level identified in the Paris accord has now been surpassed in 19 of the past 20 months and although this does not qualify as a breach of the agreement, which requires a long-term trend measured over at least two decades, we are moving closer towards the point where irreversible changes to the planet are expected to take place.
For this week’s climate graphic we wanted to draw attention to both the continued global warming trend, as well as highlight the recent record Februarys in the past few years.
Copernicus publishes monthly temperature anomaly data that track how many degrees a given point was above or below the average of a particular reference period, as well as time-series data going back to 1940.
Using the temperature anomaly data compared with the pre-industrial average, we are able to clearly see the upward trend in the bar chart.

Overlaying and connecting the February data points for each year makes it easier to compare them across time series.
I also mapped on to the chart the periods where El Niño warming events were in effect. This highlights that even though we are not in an El Niño period, global temperatures remain elevated at near record levels.
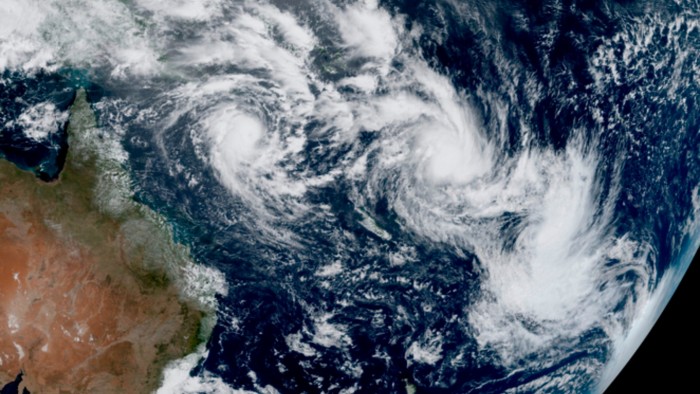
For the polar vortex animation (above), I turned to Nasa’s excellent Global Modelling and Assimilation Office database which hosts dozens of observed and forecasted weather and atmospheric variables.
Many of these data sets are provided at hourly intervals which is important when creating a smooth animation.
The downloaded files are brought into the geographical information software we use, Qgis, and styled before being exported as a series of PNG files into After Effects, the motion graphics software, where the final animation is created.
We’ve written in detail about the process of creating a polar vortex animation before (if you missed it email us at climate@ft.com and we will forward it to you).
The World Meteorological Organization said on Thursday that the weak La Niña cycle that emerged in December was likely to be brief, with a 60 per cent probability that it will shift back to neutral between March and May.
This shortened cooling period in the tropical Pacific region will probably lead to more melting of sea ice. Some studies suggest reduced sea ice cover in the Arctic will result in a weaker vortex, while others show that warming may lead to a strengthened, faster vortex.
What is not in doubt is that the disrupted and extreme weather patterns will continue to be the outcome of global warming.
Join us at the Climate & Impact Summit on 21–22 May, hosted in London and online. Bringing together business, finance and policy leaders, the event is dedicated to driving progress towards the UN Sustainable Development Goals through collaboration, innovation and investment. As a valued subscriber, enjoy 10% off your in-person pass here.
Climate Capital

Where climate change meets business, markets and politics. Explore the FT’s coverage here.
Are you curious about the FT’s environmental sustainability commitments? Find out more about our science-based targets here