
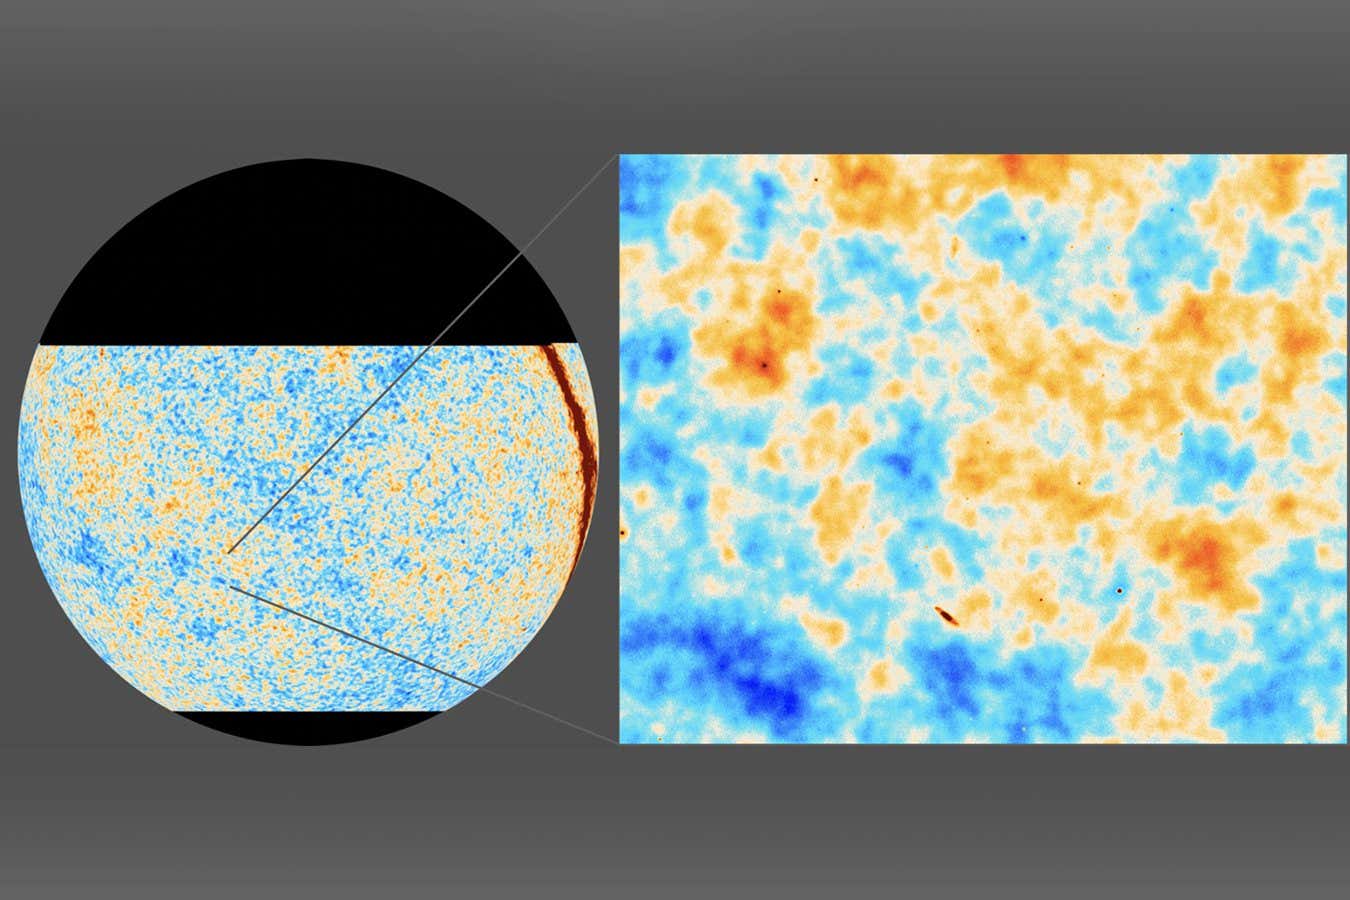
A new image of the cosmic microwave background radiation for part of the sky – the zoomed in area is about 20 times the width of the moon as seen from Earth
ACT Collaboration; ESA/Planck Collaboration
Our latest and best ever map of the early universe is five times more detailed than anything we have had before, but while it precisely backs up the leading model of the universe, it is also a double-edged sword because the new data also offers no clues to solving some of cosmology’s biggest mysteries.
The map shows the cosmic microwave background (CMB), a faint remnant radiation from the early stages of the universe. It began as the earliest light just 380,000 years after the big bang, but billions of years of the universe expanding have shifted its frequency from the visible spectrum to microwave.
Now, new data from the Atacama Cosmology Telescope (ACT) has given us a clearer image of the CMB – albeit only from the half of the sky that can be imaged from the observatory’s location in Chile.
Jo Dunkley at Princeton University, who worked on the project, says that the data has nailed down with better precision the ingredients of the universe, its size, its age and its expansion rate. But the really key discovery was that nothing contradicted the current leading model of the universe, known as lambda-CDM.
Previous data put the age of the universe at 13.8 billion years and the rate at which it is expanding – known as the Hubble constant – at 67 to 68 kilometres per second per megaparsec distance from Earth. ACT data essentially confirms this, but increases the precision and confidence in those findings.
The CMB was first mapped by NASA’s Cosmic Background Explorer (COBE) in the 1980s and 90s, then by NASA’s Wilkinson Microwave Anisotropy Probe (WMAP) in the 2000s and then in yet greater detail by the European Space Agency’s Planck spacecraft from 2009 to 2013. Each mission provided successively more detailed maps of the CMB, advancing our knowledge of cosmology and understanding of the early universe.
One limitation of ACT is that it is a ground-based telescope, unlike these previous space-based missions, which is why it is limited to just one half of the sky. Despite this, ACT gives not only better resolution and sensitivity than these previous maps, but it also measures the polarisation of the CMB, or the orientation in which light waves oscillate, revealing some information about how the CMB light has evolved over time.
“By looking at the polarisation of the CMB in better detail we could have seen something different. We could have seen the standard cosmological model breaking,” says Dunkley. “Because whenever you look at the universe in a different way, you can’t be sure that your original model is still going to work. We were quite ready to see something departing from that model, some subtlety. But we haven’t.”
This may be reassuring for those working on lambda-CDM, but hasn’t been welcome news for all scientists. Colin Hill at Columbia University in New York says that he was hoping to see some evidence in the data for an as-yet-unexplained phenomenon – perhaps a new type of energy or particle – which could help explain the so-called Hubble tension: the discrepancy between the rate of expansion in the universe given by the lambda-CDM standard model and what we measure directly.
“We’ve all just been blown away by how consistent [the ACT data] really is with the standard model. We’re all trying to poke and prod the model from different aspects and look for a place where it’s going to crack, and where nature will give us something to sink our teeth into. And so far, nature hasn’t yielded that crack,” says Hill.
He says that the most viable theories for the Hubble tension discrepancy require phenomena which simply don’t appear in the ACT data, which is currently the best we have. This will force scientists back to the drawing board to seek another explanation. “The new measurements are going to put theorists, including myself, into an even tighter straitjacket,” says Hill. “It deepens the mystery.”
ACT collected the data that makes up this new map between 2017 and 2022, but has now been shut down. Dunkley says that we are unlikely to get a higher resolution map for some years, although a new telescope in Chile will start work later this year. As for the other half of the sky, only two locations on Earth are likely to be able to host new telescopes that would yield results: Greenland and Tibet. Dunkley says that unfortunately Greenland doesn’t yet have the necessary infrastructure for such a project, and Tibet is politically sensitive.
Jens Chluba at the University of Manchester, UK, says that while scientists on the project have already been working with the data, the open release of the ACT map will now spark a flurry of activity.
“The whole cosmology community can get their hands on the data and do all kind of cross-analysis with their data sets,” says Chluba. “It’s super exciting and I’m pretty sure there will be a burst of follow-up publications after this.”
Spend a weekend with some of the brightest minds in science, as you explore the mysteries of the universe in an exciting programme that includes an excursion to see the iconic Lovell Telescope. newsfromrss.com
Mysteries of the universe: Cheshire, England